How good is HBase 2.x write performance? Let’s benchmark it.
Test environment: five-node cluster; each node has twelve 800GB SSDs, 24 CPU cores, 128GB RAM. HBase and HDFS are co-located—RegionServer and DataNode on the same host for better write locality (at least one replica local). Software: HBase 2.1.2, HDFS 2.6.0, OpenJDK 1.8.0_202.
Per RegionServer we use 50GB heap and 50GB off-heap (100GB total)—heap mainly for memstore (~36GB), off-heap mainly for BucketCache (~36GB). Even for a 100% write test we kept 50GB off-heap for BucketCache to match production.
We preloaded 10 billion rows at 100 bytes per row with YCSB using BufferMutator batch writes—~200k QPS per machine, so load finished quickly.
Baseline Write Performance
We then measured single-row Put latency (autoflush=true) on the 10B-row dataset with continuous YCSB writes:
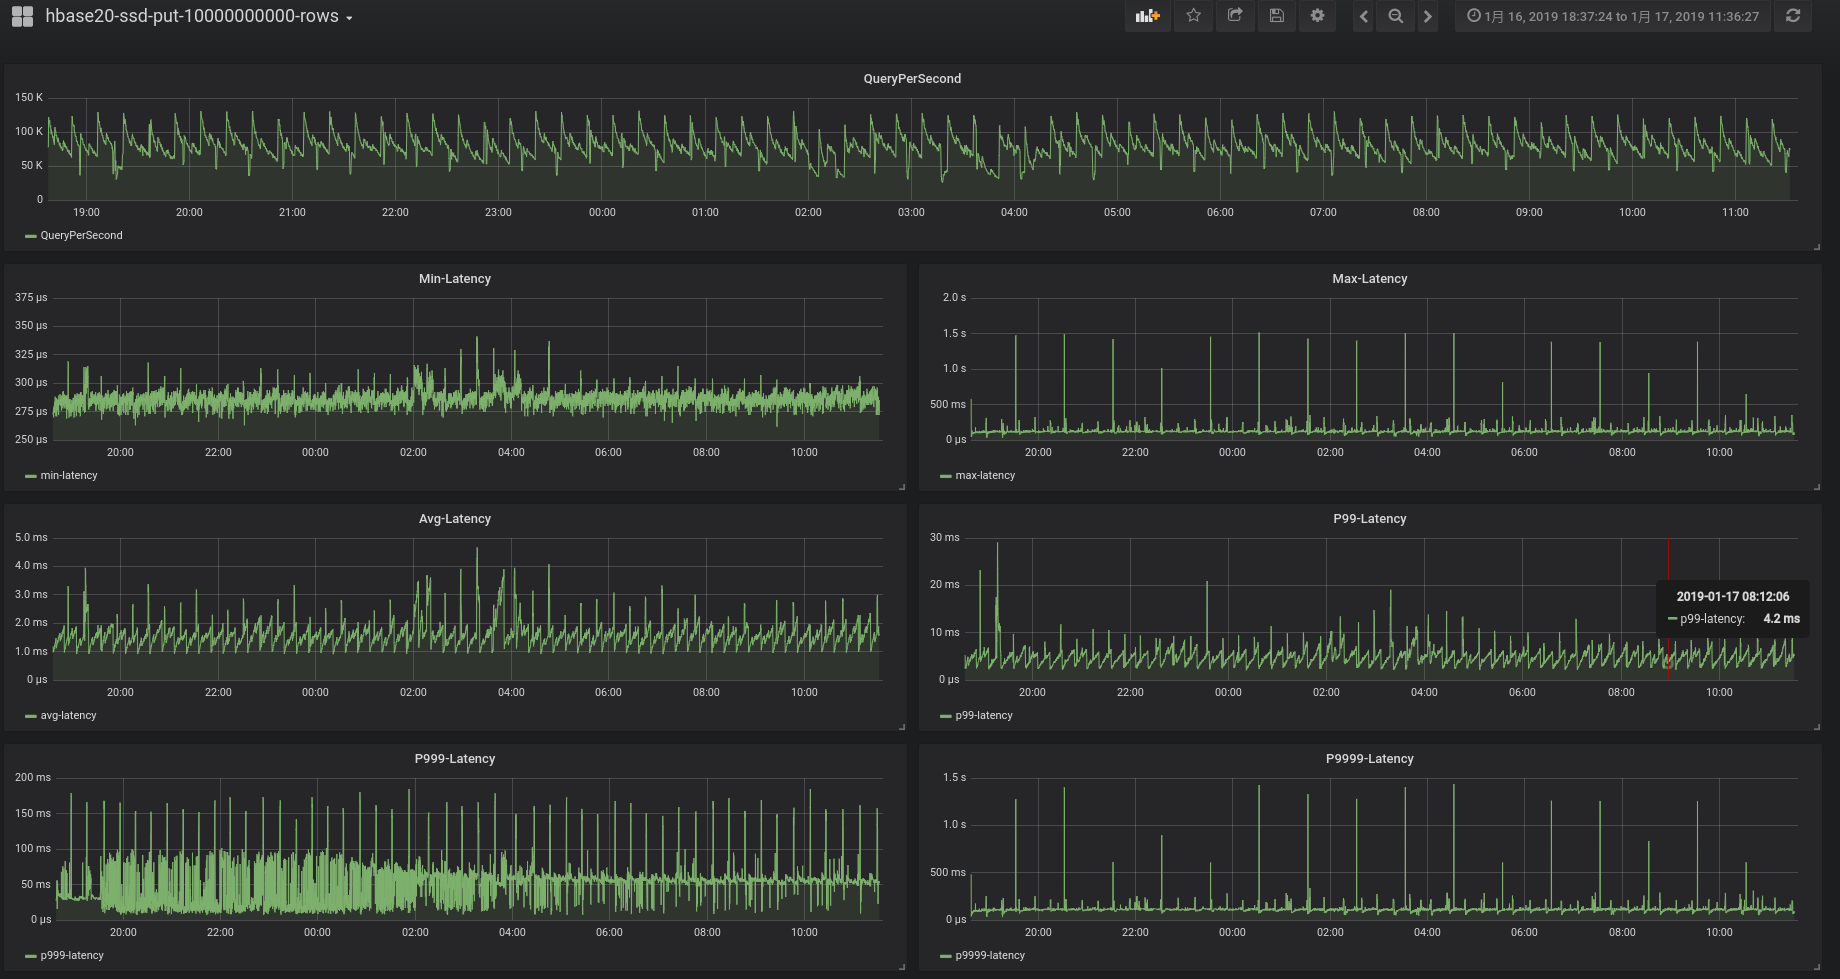
Cluster total QPS ~100k/s (~20k+/s per node), avg latency <4ms, p99 <20ms—solid on paper. But clear issues:
- QPS shows periodic peaks and valleys (~every 15 minutes) with matching avg-latency swings—bad for workloads capped in the valleys.
- Frequent p999 spikes to ~150ms—~100ms above typical p999.
- Some p9999 spikes exceed 1s.
Taming the Spikes
We correlated valleys with memstore flush in RegionServer logs; p999 spikes also aligned with flush. Likely causes:
- In this test, regions and write rates were perfectly balanced—many regions could flush together, spiking disk writes and hurting throughput/latency.
- Flush has two phases: (1) take write lock, snapshot memstore, release lock; (2) async flush snapshot to HFile. Phase 1 blocks writes—any slow work there spikes latency.
(1) is rare in production—loads are never perfectly even, and throttling can smooth flush. We focused on (2).
We logged lock hold time during snapshot and saw:
“–> Memstore snapshotting cost: 146ms”
Snapshot sometimes took a long time. The stack:
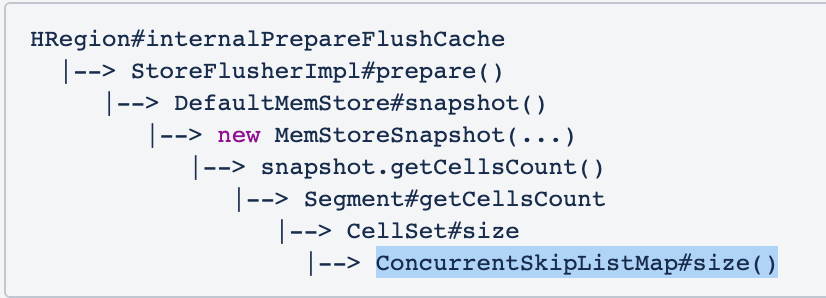
Memstore snapshot called ConcurrentSkipListMap#size(), which is O(N)—for a 256MB memstore it walks every KV to count entries. ConcurrentSkipListMap avoids maintaining a thread-safe size on update/delete for write concurrency, so size is computed on demand.
This bug hid in the tree from 0.98 through 2.0 and 3.0 without reports. Details: HBASE-21738.
The fix is straightforward: remove or replace the expensive size() call. It is in recent branch releases; upgrade if you care about latency. Retest:
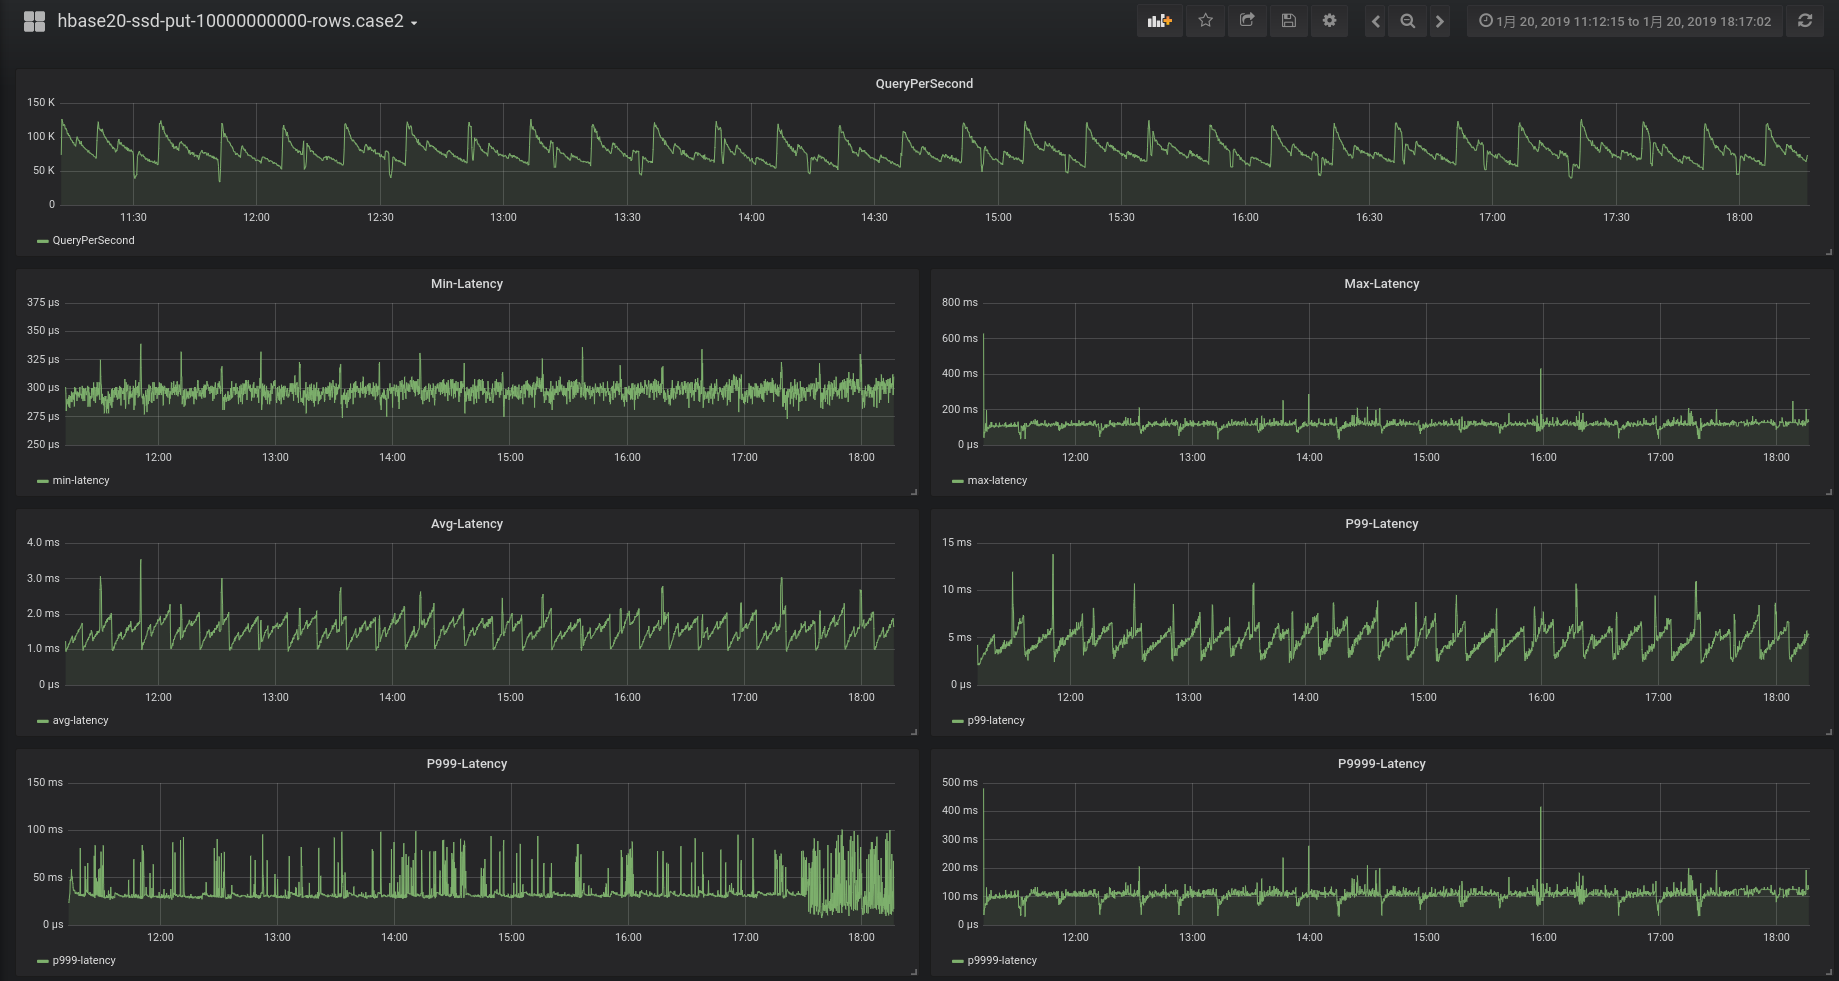
p999 stayed under ~100ms; p9999 dropped from ~1000ms to ~200–500ms—the fix clearly helped spikes.
In-Memory Compaction for Further Spike Reduction
p999 ~100ms still felt high—most points were <40ms but GC STW pulled the aggregate up; spike times matched ~100ms STW.
We enabled in-memory compaction from HBase 2.0: split a 256MB memstore into multiple ~2MB sorted segments—one mutable, rest immutable. Writes go to mutable; when it exceeds ~2MB it becomes immutable and a new mutable segment opens. Immutable segments can use sorted arrays instead of ConcurrentSkipListMap, cutting heap and GC. MSLAB can move off-heap so the memstore barely touches heap—strong theoretical gains. We tested with CompactingMemstore; MSLAB remained on-heap (off-heap MSLAB: hbase.regionserver.offheap.global.memstore.size=36864 for 36GB).
Key RegionServer settings:
hbase.hregion.memstore.block.multiplier=5
hbase.hregion.memstore.flush.size=268435456
hbase.regionserver.global.memstore.size=0.4
hbase.regionserver.global.memstore.size.lower.limit=0.625
hbase.hregion.compacting.memstore.type=BASIC
Results:
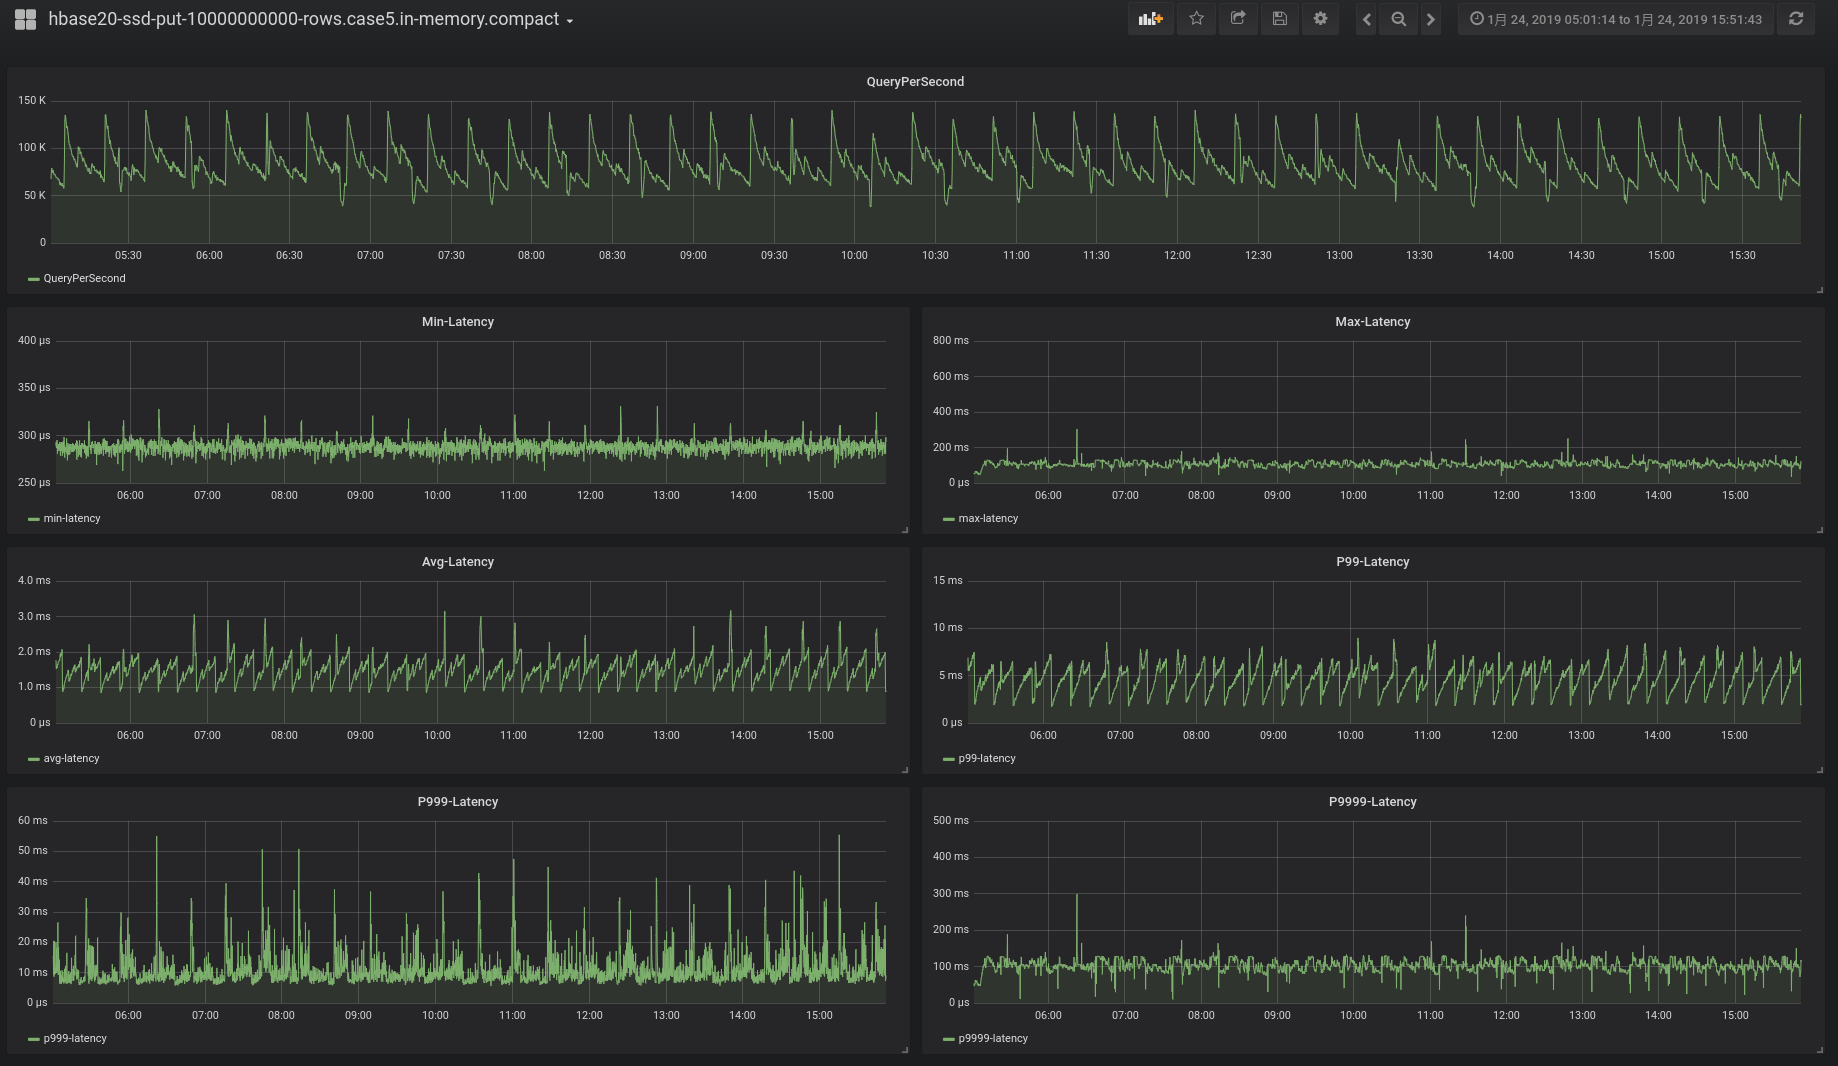
p999 under ~50ms, p9999 ~100ms—much better than 200–500ms—with little loss in throughput or avg latency. Off-heap CompactingMemstore should tighten spikes further at possible avg-latency cost; we did not run those numbers here.
Summary
HBase 2.1.2 write throughput and average latency are strong, but spikes can hurt. After HBASE-21738, p999 is mostly under ~100ms (often <40ms except GC STW). In-memory compaction on heap brought p999 under ~50ms and p9999 under ~100ms. HBase 2.1.3 and 2.2.0 are very capable performance releases.